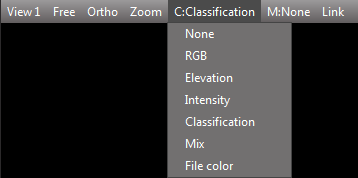
C:None / RGB / Elevation / Intensity / Classification / Mix / File color
M:None / Solid / RGB / Elevation / Intensity / Classification / Mix / File color
Display modes refer to both point clouds (C:) and models (M:).
Note: The graphic interface allows you to change the basic options for displaying point clouds and models. Specific display modes parameters can be changed in the Display Options window.
RGB
Point cloud displayed in natural colors.
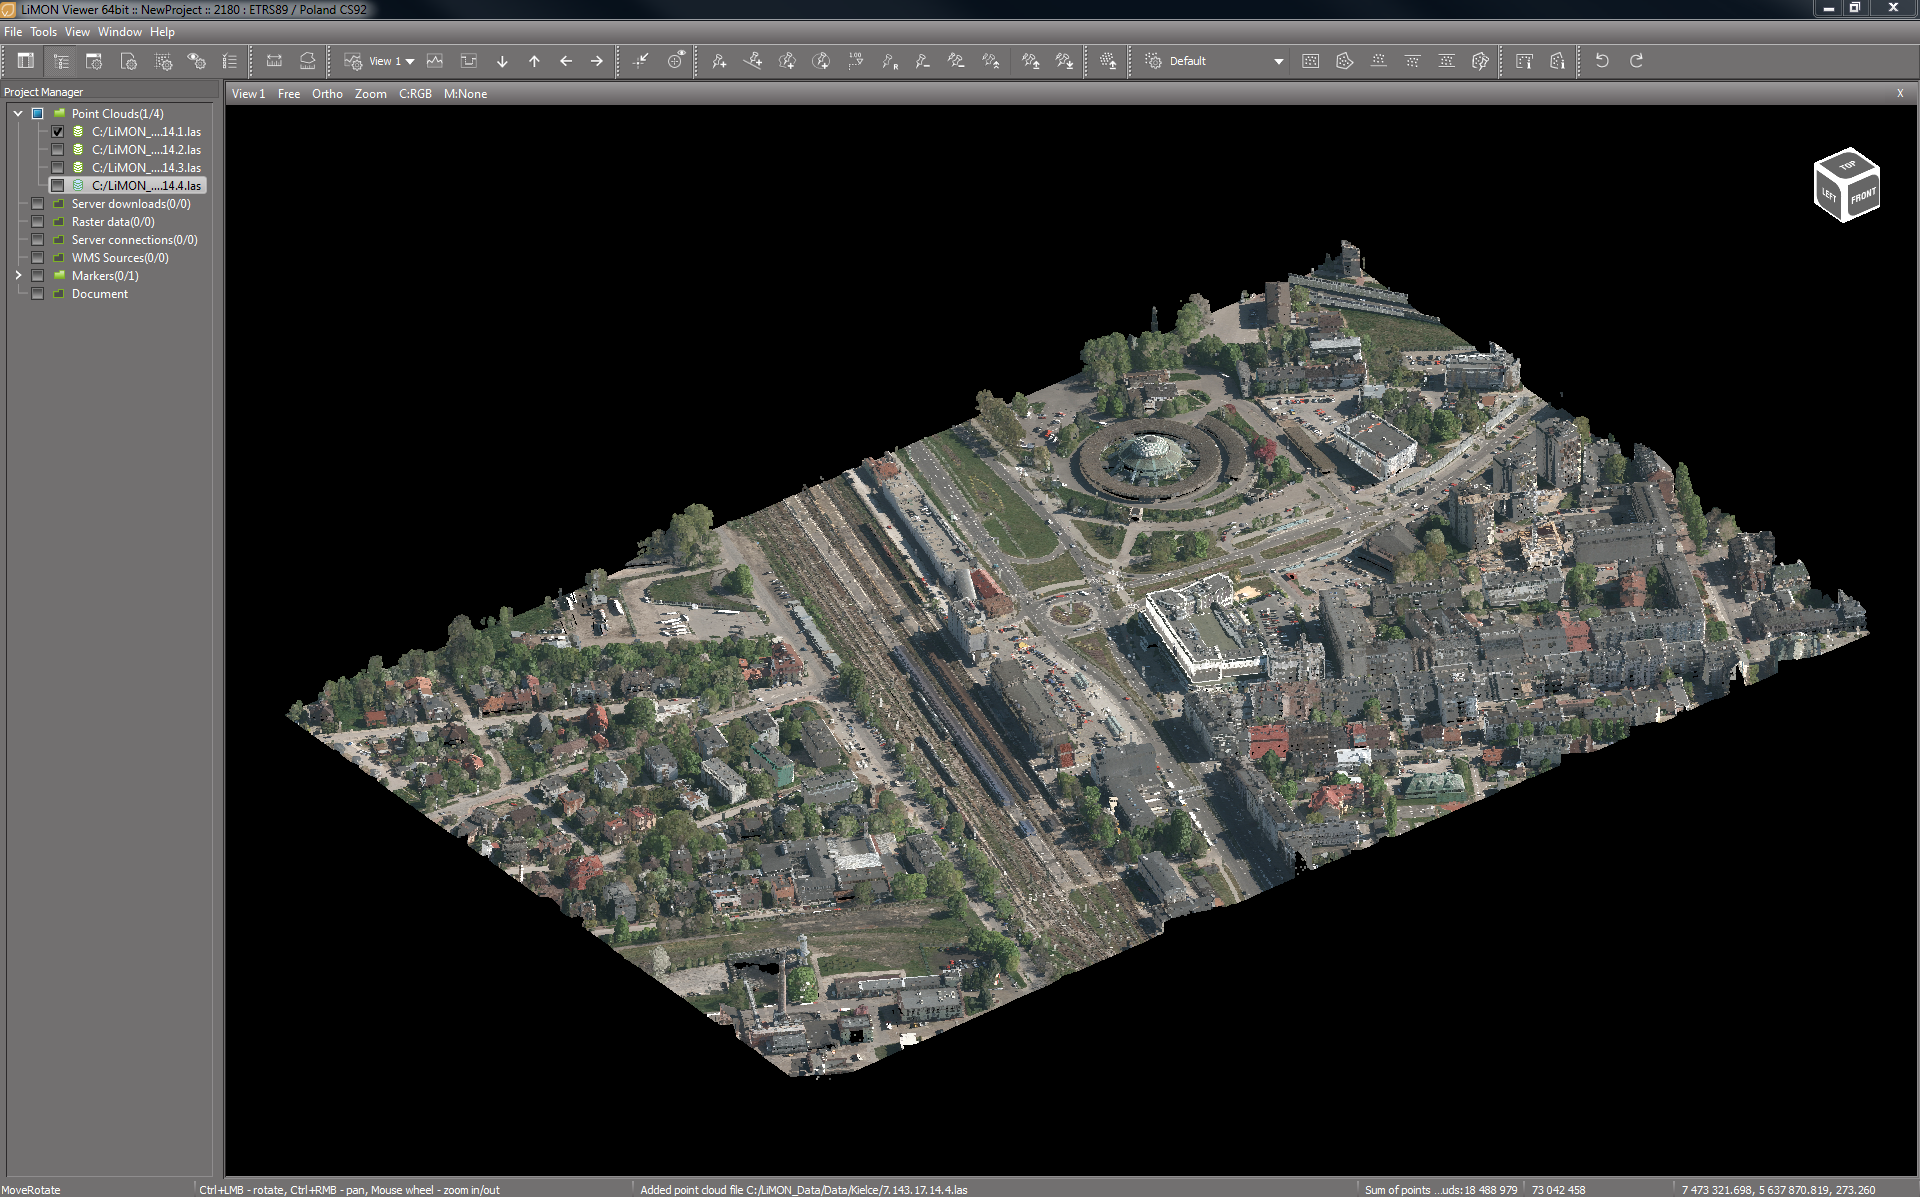
Point cloud displayed in RGB mode (natural colors)
Elevation
In Elevation mode, the color of each point is given based on its height and selected color scheme. In the Display Options, you can select the color scheme and edit its color palette or set the beginning and span of the color scale.
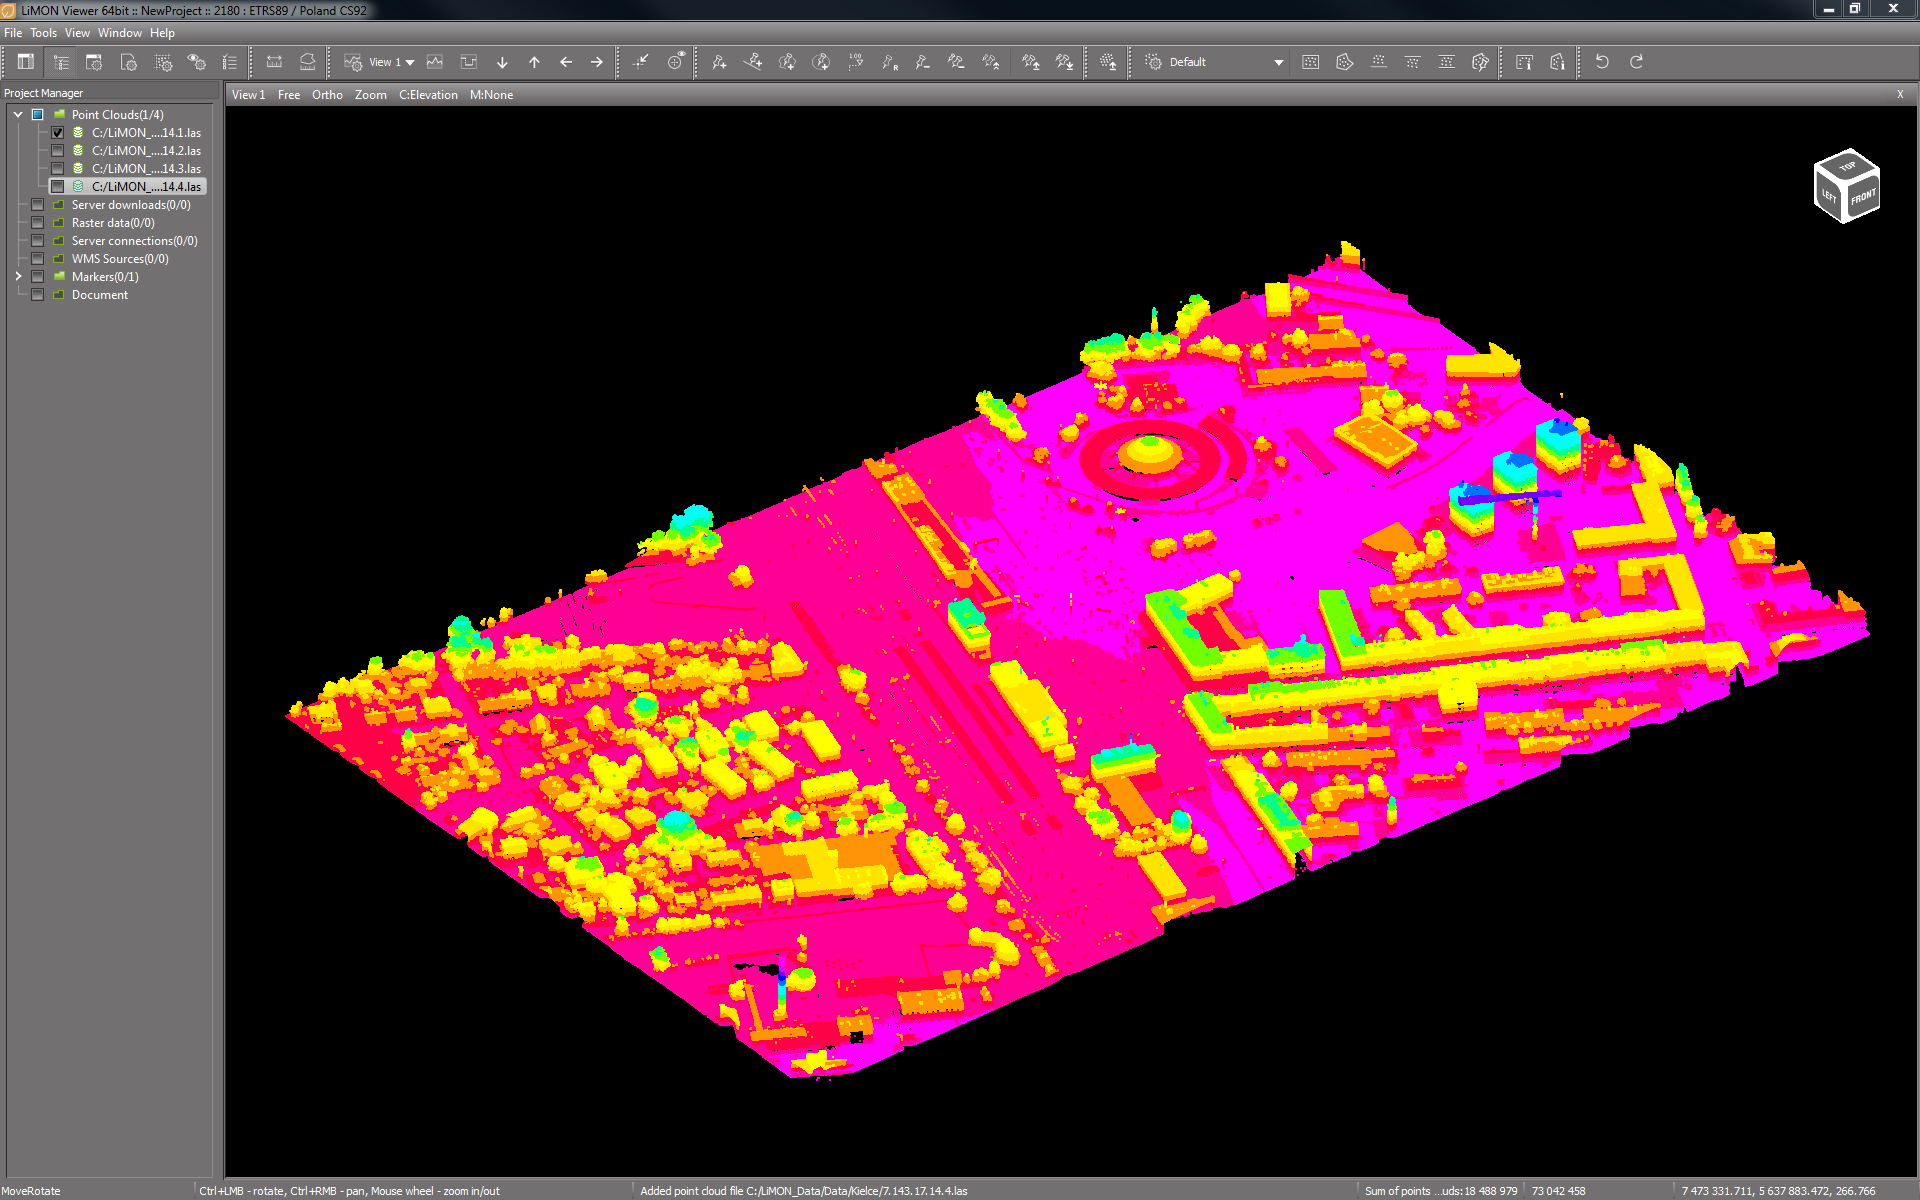
Point cloud displayed in Elevation mode (point color based on its height)
Intensity
The point color is determined based on the intensity of the signal reflection registered by the scanner. In the Display options it is possible, among others define a color palette and adjust the display options for a given intensity range.
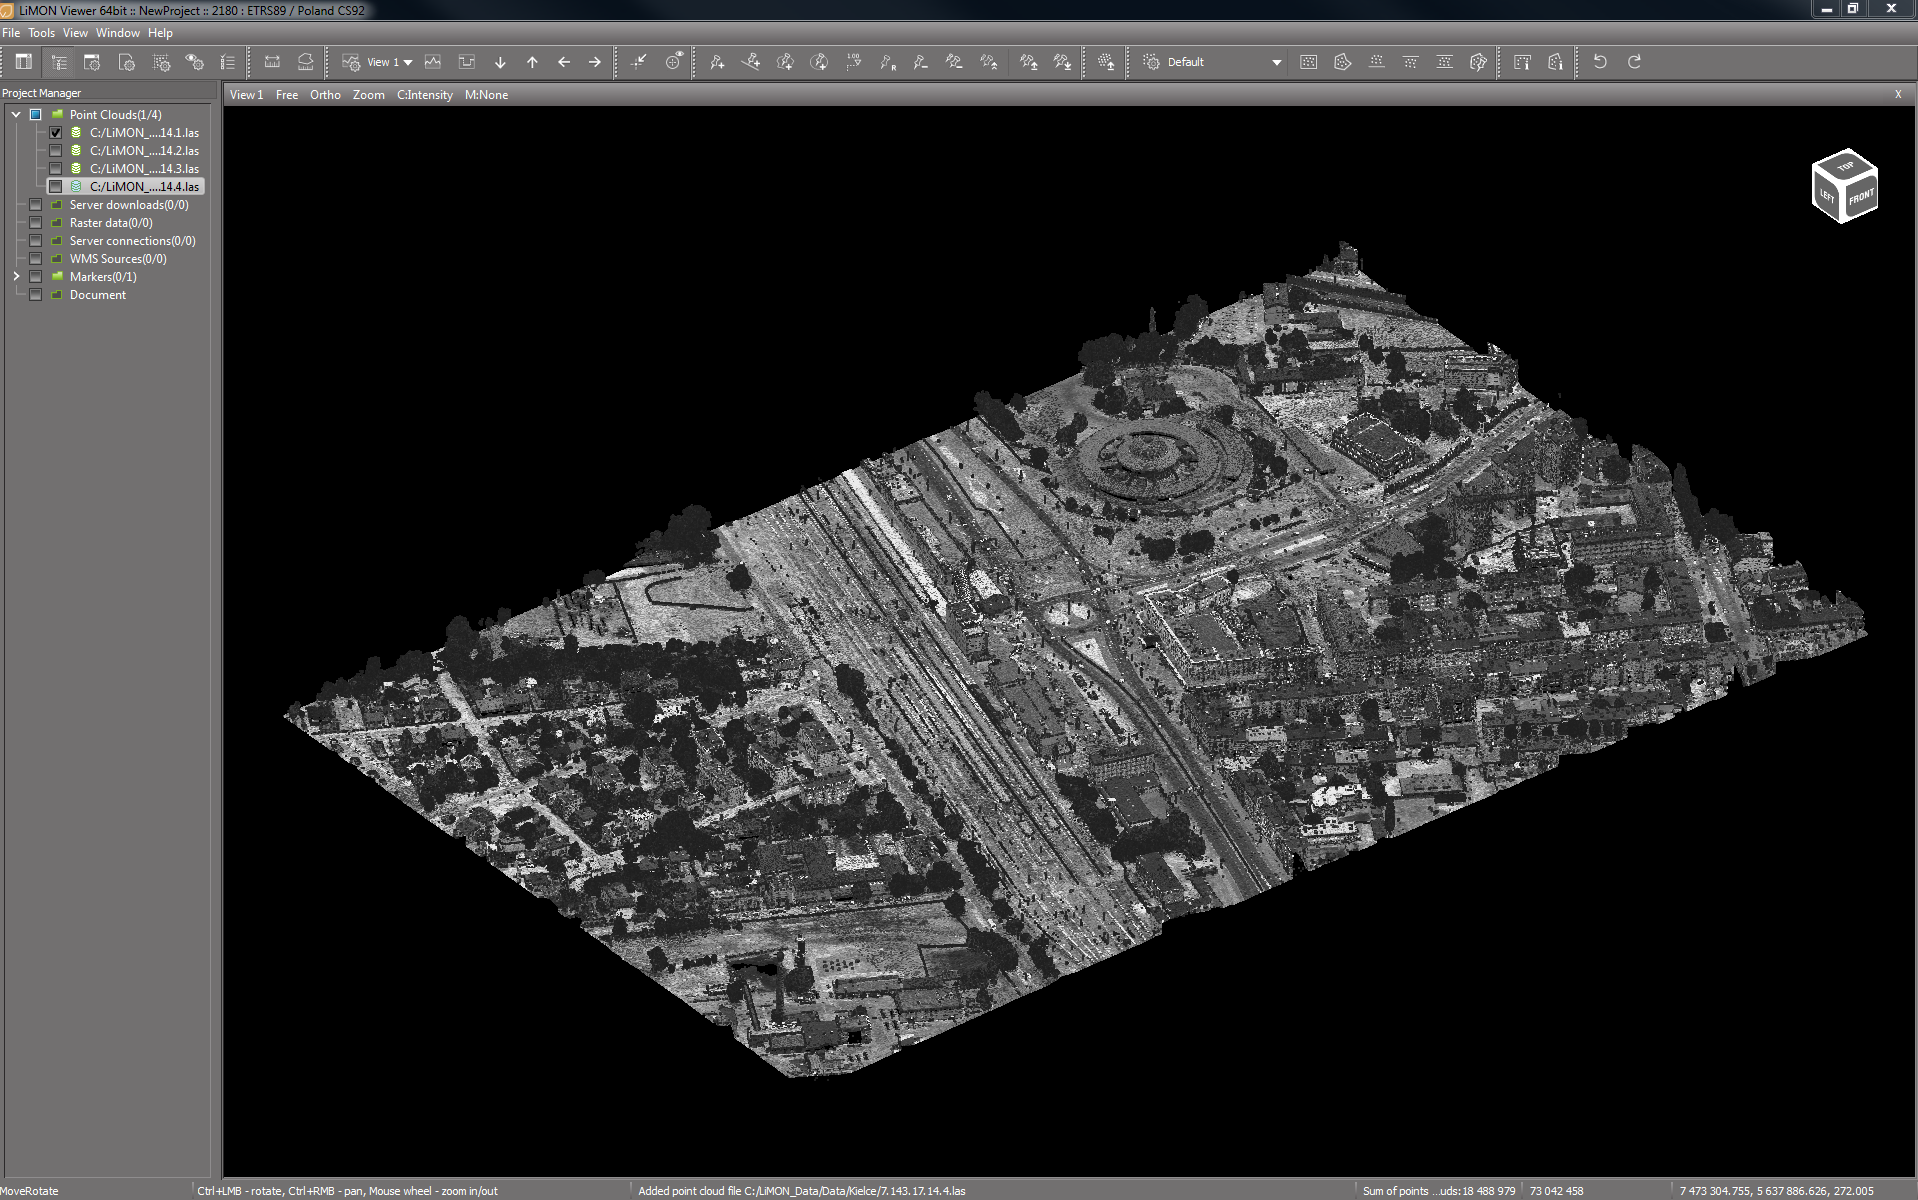
Point cloud displayed in Intensity mode (the color of the point corresponds to the intensity of the reflected signal - the color is shown by default in the gray scale)
Classification
Display of point clouds based on assigned classes. In the case of data from aerial laser scanning, point classes are most often compliant with the ASPRS standard (American Society for Photogrammetry and Remote Sensing):
Class number |
Class name |
0 |
Created never classified |
1 |
Unclassified |
2 |
Ground |
3 |
Low Vegetation |
4 |
Medium Vegetation |
5 |
High Vegetation |
6 |
Building |
7 |
Low Point (noise) |
8 |
Model Key-point (mass point) |
9 |
Water |
10 |
Reserved for ASPRS Definition |
11 |
Reserved for ASPRS Definition |
12 |
Overlap Points |
13-31 |
Reserved for ASPRS Definition |
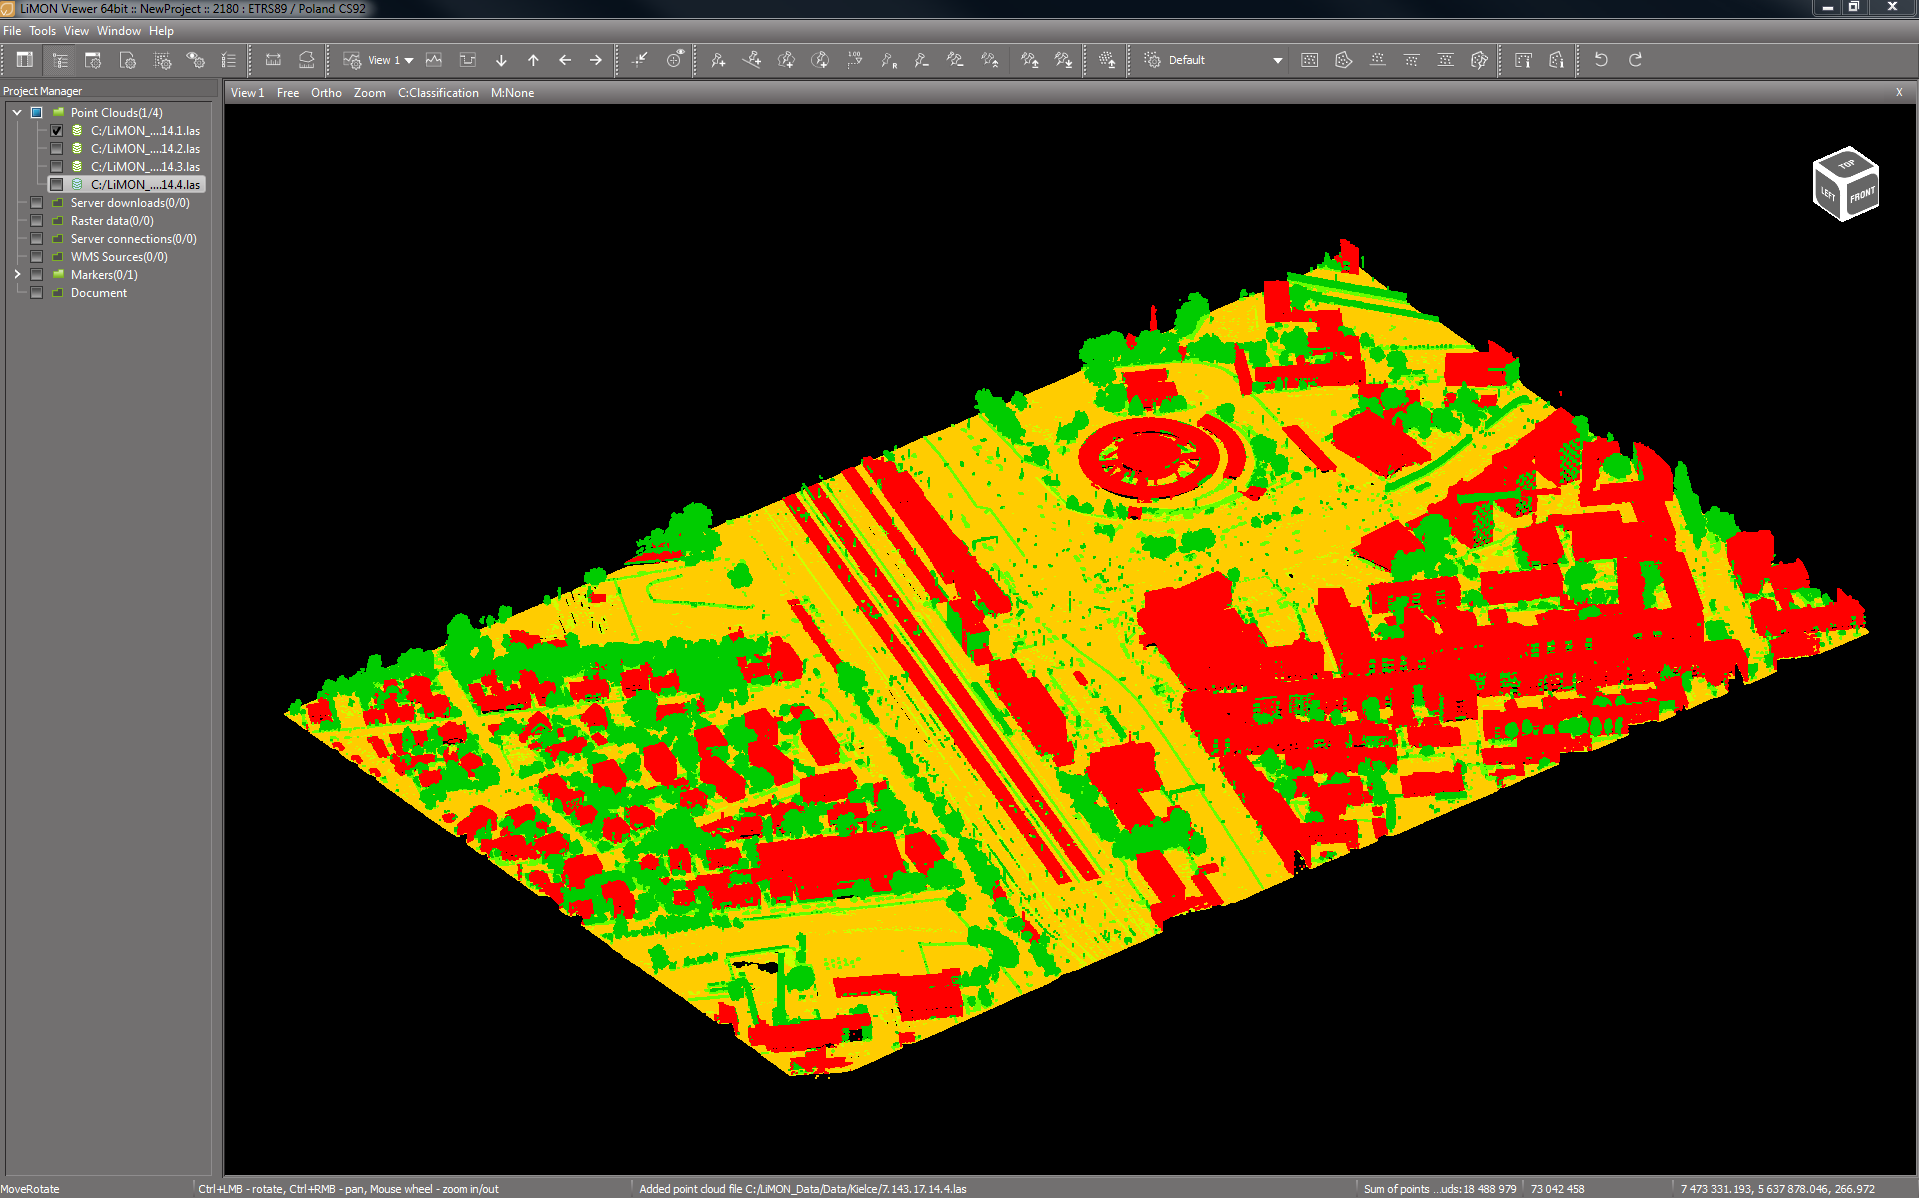
Point cloud displayed in the Classification mode (the color of the point corresponds to the color of the assigned class)
In the Display options, you can set the color scheme for each class. The Display mode window allows you to disable selected classes from the view. In the LiMON Editor, you can perform manual and automatic (Editor PRO version) point cloud classification. For more information, see the chapter LiMON Editor.
Mix
Mix mode allows you to color each point using information from different display modes. Percent of participation of each individual display mode in the coloring of the point cloud is set in the Display options.

Point cloud displayed in the Mix mode
File Color
Coloring point cloud by file color allows you to compare data from different time. The color of each point cloud can be edited in Property Inspector.
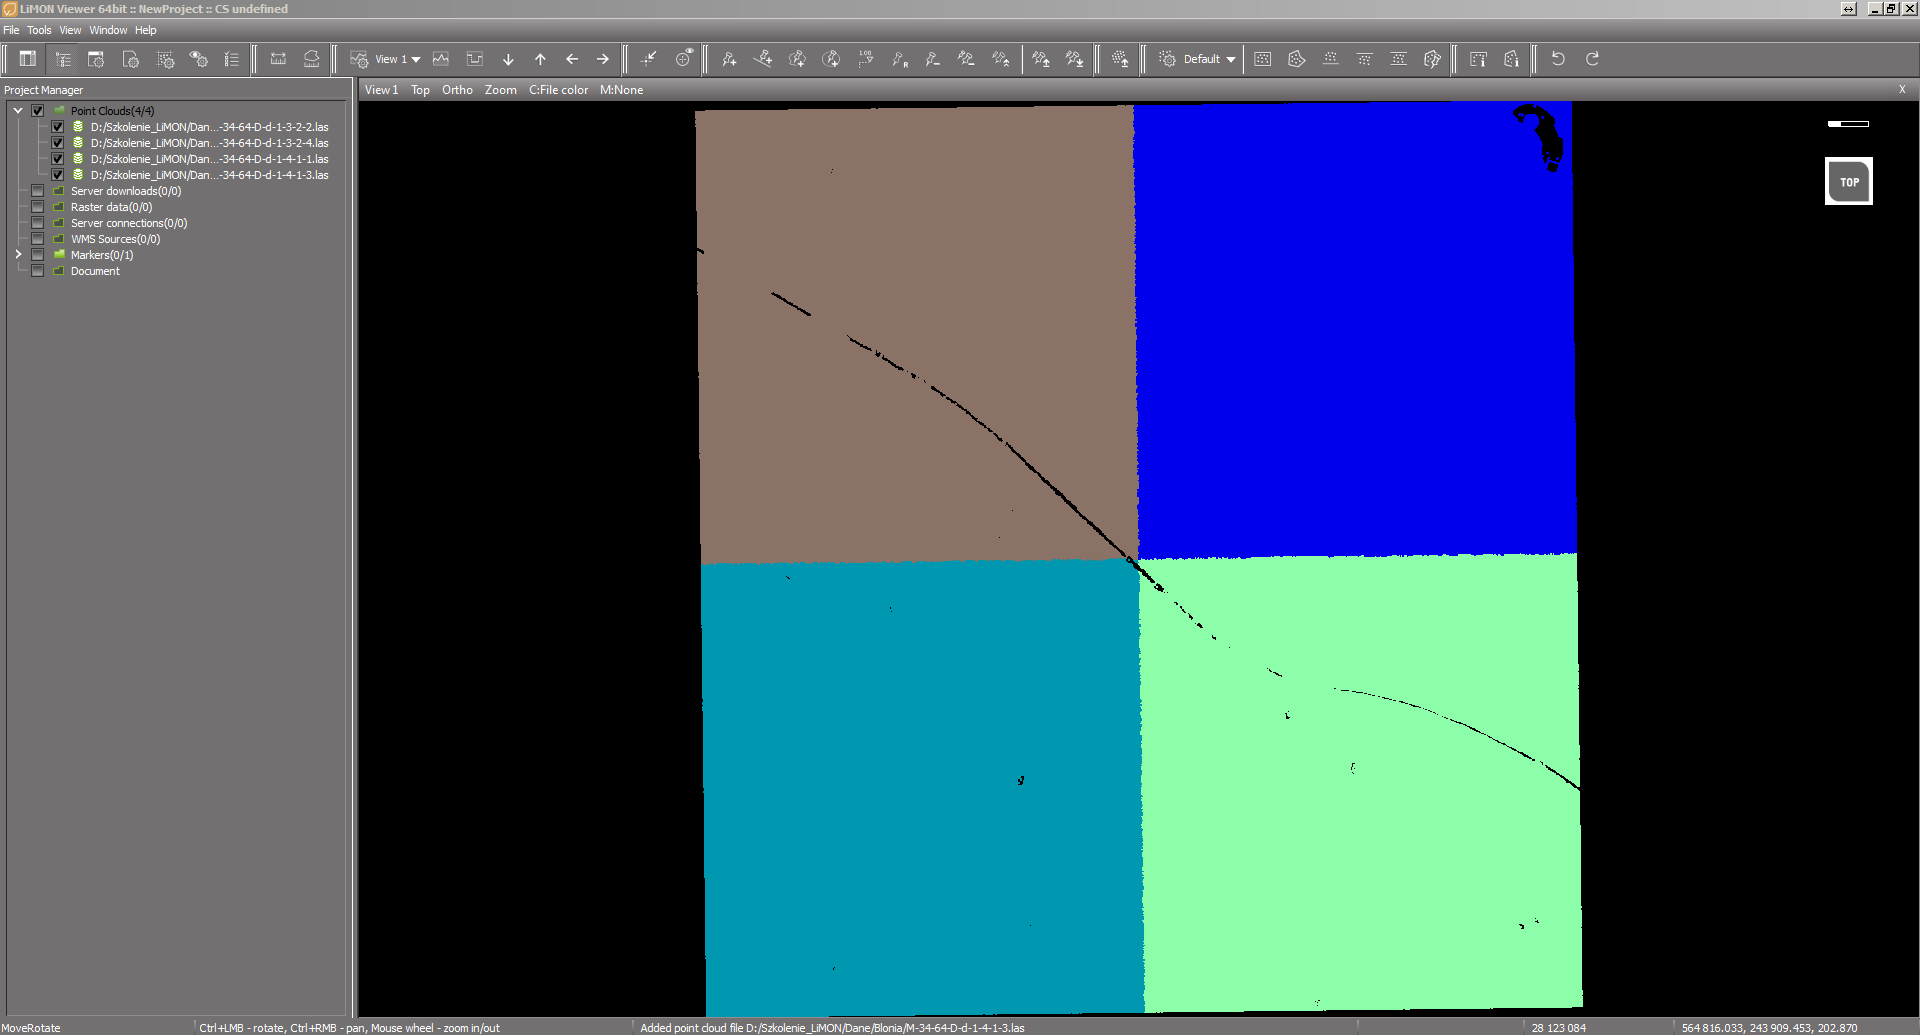
4 point clouds displayed in the File color mode

Comparison of data from different periods