Tools >> Clouds >> Create density map
The density map is a tool used to control point clouds in terms of meeting the assumed density parameters (the number of points per 1 m2). The density of the point cloud is represented by a color scale, where each density range is assigned a suitable color. The map is saved in * .tif format and can be loaded into the program as a raster data.
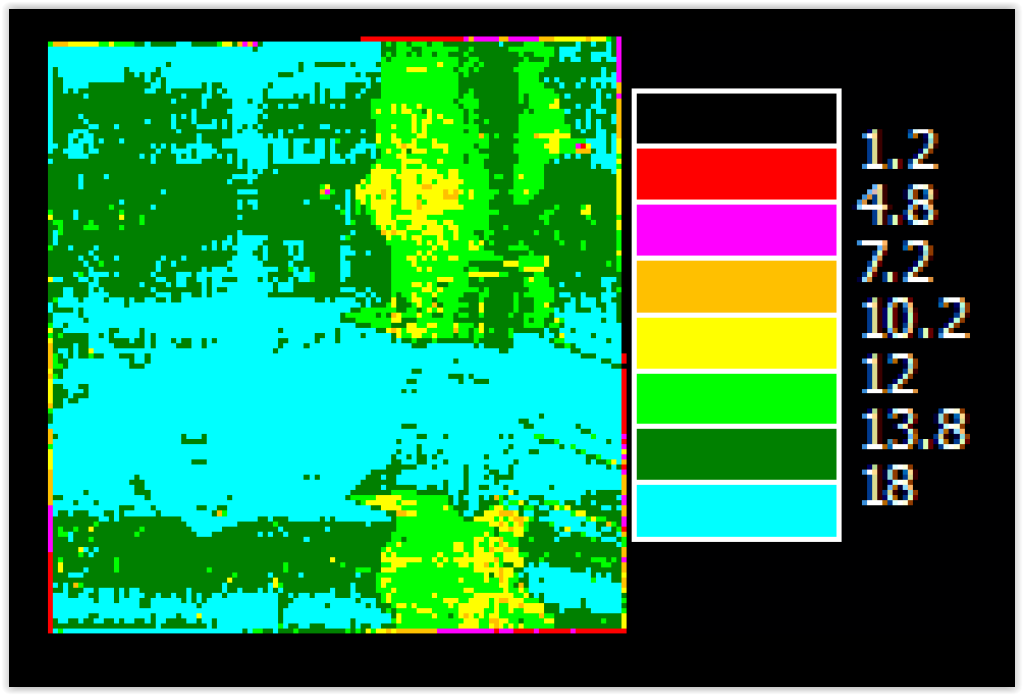
Density map

Active color scheme |
color scheme selection (High, Intermediate, Low) |
Active range square side length [m] |
determines the side length of a single field which is used for point cloud density computation (in meters). The smaller the value, the greater the map resolution. |
Required density level [pts/m2] |
enter the assumed density in the field. On the map this value is highlighted in green color by default |
Return number |
determines whether the first or last point reflection will be taken into account when determining the density map |
Use 'Overlaped' class info (if existing) |
the function enable to exclude overlapping points from the analysis |
Edytuj palette |
the function allows you to edit the color palette and save and load color schemes |
Compute densities |
after pressing the button and indicating the result file location, the program will start creating a density map |

Edition of density palette
Note: The density map, like other raster files, is visible only in the top view.
Hotkey: Tools.CreateDensityMapDialog